Best of ICMI in 2022 - #6:
Many contact centers are currently understaffed—the result of staff turnover, growing workloads, and other challenges related to the pandemic. As a result, many managers have turned to average speed of answer (ASA) as their indication of customer wait times.
This metric reflects the amount of time customers spend in queue, waiting to reach agents. All customers—those who wait and those who get right through—are included in the calculation. As a report, ASA is available from virtually any contact distribution system.
As a metric, ASA is mathematically sound. The problem, as we’ll see, is in interpretation.
Let’s say you expect around 250 contacts in a given half hour and anticipate an average handling time of 3.5 minutes. If you want to achieve an ASA of between 10 and 15 seconds, you’ll need 34 agents. According to the widely-used queuing formula Erlang C, 34 agents will produce an ASA of between 10 and 15 seconds.
So in this scenario, all goes as planned and the contact center shows an ASA of 10 to 15 seconds. Yet your systems also report that some customers wait up to three minutes to get through. That just doesn’t seem to make sense—180 seconds sure doesn’t look like 10 to 15 seconds. Surely no one could have waited over 30 seconds, right?
Take a deeper look at wait times, though, and the real story becomes clear.
What happens to individual callers? (This illustration is based on the Customer Queue Calculator, a free Excel-based program available here. Similar low- or no-cost calculators are available from many sources. As shown:
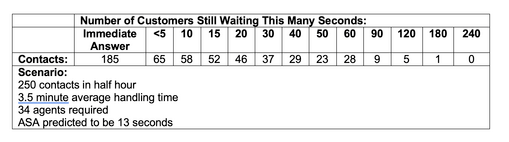
- Sixty-five customers will wait five seconds or longer.
- In the next five seconds, seven of those customers reach agents, so 58 customers are still waiting 10 seconds or longer.
- In the next five seconds, six more customers will reach agents, leaving 52 callers waiting 15 seconds or more.
And so forth. There's still a customer waiting at three minutes.
In short, ASA does not reflect a “typical experience.” Because of random contact arrival, different customers experience very different queue times. Most reach agents more quickly than ASA, and some wait far beyond ASA. It would be a mistake to assume that ASA represents a typical experience.
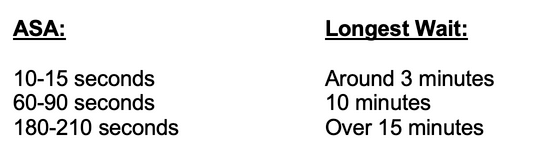
Here are how longest waits correspond to various ASAs for this workload:
As a rule, we recommend service level over ASA. Service level is expressed as X percent of contacts answered in Y seconds—e.g., 80 percent answered within 20 seconds, or 90% answered within 15 seconds. While it takes some explaining to an outsider, service level is a more stable and reliable measure of the wait time which customers experience.
There’s a catch to using service level, though—and that catch is part of the reason some are focusing on ASA, given current staffing and workload mismatches. If you are understaffed, there may be increments where no contacts reach agents within Y seconds. In this case, service level reports don’t tell you much other than wait times were long. In this case, ASA would give you a relative sense of trends.If you do use ASA, use it only as a supplement to service level. Keep an eye on longest waits, and ensure all on your team understand how misleading ASA can be. ASA is not a bell-shaped curve. Longest waits are far beyond what ASA, at face value, suggests.