 Each month MetricNet highlights one Key Performance Indicator for the contact center. We define the KPI, provide recent benchmarking data for the metric, and discuss key correlations and cause-and-effect relationships for the metric. The purpose of this column is to familiarize you with the Key Performance Indicators that really matter to your organization, and to provide you with actionable insight on how to leverage these KPIs to improve your performance.
This Month’s Metric: Customer Satisfaction
Customer Satisfaction is the percentage of customers that are either satisfied or very satisfied with the quality of a given interaction. For this reason, it is called a transactional metric because it measures the quality of a given transaction with the contact center. Although there are numerous quality metrics for the contact center – including call quality, customer effort, and net promoter score – customer satisfaction remains the single most important measure of quality.
Cost vs. Quality
Any discussion of customer satisfaction must take place in the context of cost. Customer satisfaction and cost per contact are the yin and yang of a contact center. These metrics are in constant tension, and every contact center grapples with how to strike an appropriate balance between the two. With no restraints on spending, it is relatively easy for a contact center to “spend its way” to high customer satisfaction. Conversely, if customer satisfaction is not an issue, a contact center can reduce its costs almost indefinitely.
Every contact center does, of course, operate with both spending limitations and quality standards. The objective, therefore, is to achieve the highest possible quality within the budgetary constraints placed on an organization. Some contact centers that operate under severe budgetary restrictions are doing quite well when they achieve a 75% customer satisfaction score. By contrast, a contact center with a relatively generous budget that achieves an 85% customer satisfaction score may not be doing so well, despite having a higher absolute customer satisfaction score. The point is that cost matters, and customer satisfaction must be interpreted in light of the spending constraints that a contact center operates under.
Figure 1 below shows the relationship between customer satisfaction and cost per contact for a representative cross-section of global contact centers. The tradeoff between cost and quality is apparent, but at any given spending level the more effective support organizations are able to achieve higher levels of customer satisfaction.
Figure 1: Cost per Contact vs. Customer Satisfaction
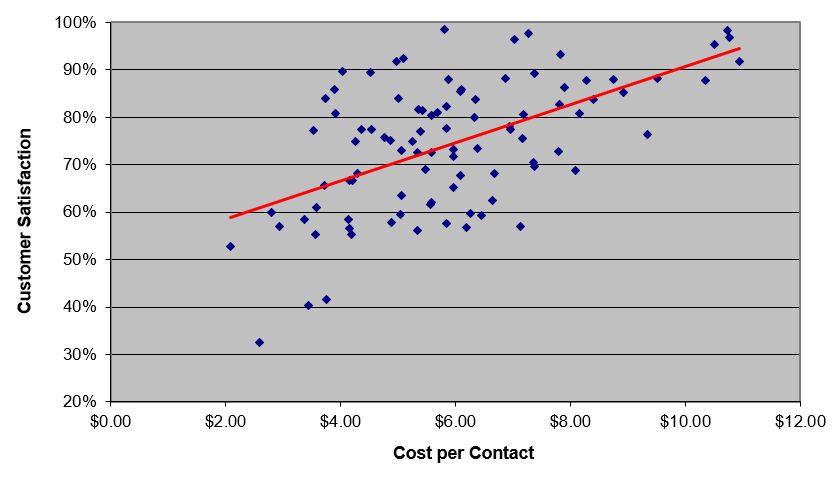
Cost per contact and customer satisfaction are often referred to as the foundation metrics in customer service because everything boils down to these two metrics. This insight is both enlightening and liberating. Viewed through the twin lenses of “will it reduce cost” and “will it improve customer satisfaction,” management decisions are often greatly simplified by answering these two questions.
How It’s Measured
There are almost as many different ways to measure customer satisfaction as there are contact centers that track the metric. I have seen surveys that contain as few as one question, and surveys that contain as many as 40 questions. I have seen multiple choice, fill-in-the-blank, and interview style surveys. I have seen scoring systems that offer as few as two choices per question, and as many as twelve choices per question. The result is that customer satisfaction has the greatest variability of any metric in the contact center.
When you think about the number of different survey questions, survey types, scoring scales, and survey populations, it’s easy to understand why survey bias and invalid survey methodologies are so common in the industry. HDI’s Customer Satisfaction Index has addressed this shortcoming, and presents a valid, standardized approach to measuring customer satisfaction. Although it was developed specifically for technical support organizations, the survey and methodology are valid for contact centers as well.
Benchmark Data for Customer Satisfaction
Industry data from MetricNet’s global benchmarking database shows that the average customer satisfaction is 74.4%, but ranges widely, from a high of 98.6% to a low of 32.6%.
Figure 2: Industry Benchmarks for Customer Satisfaction

Drivers of Customer Satisfaction
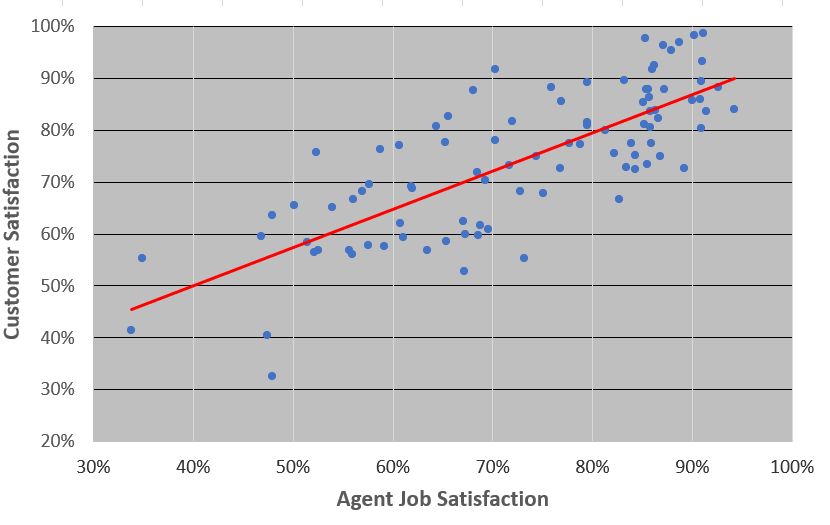
The two biggest drivers of customer satisfaction are first contact resolution and agent job satisfaction, as illustrated in Figures 2 through 4, below. The implication is that the surest way to improve customer satisfaction is to increase both first contact resolution rate and agent job satisfaction.
Figure 3: KPI Cause-and-Effect Diagram
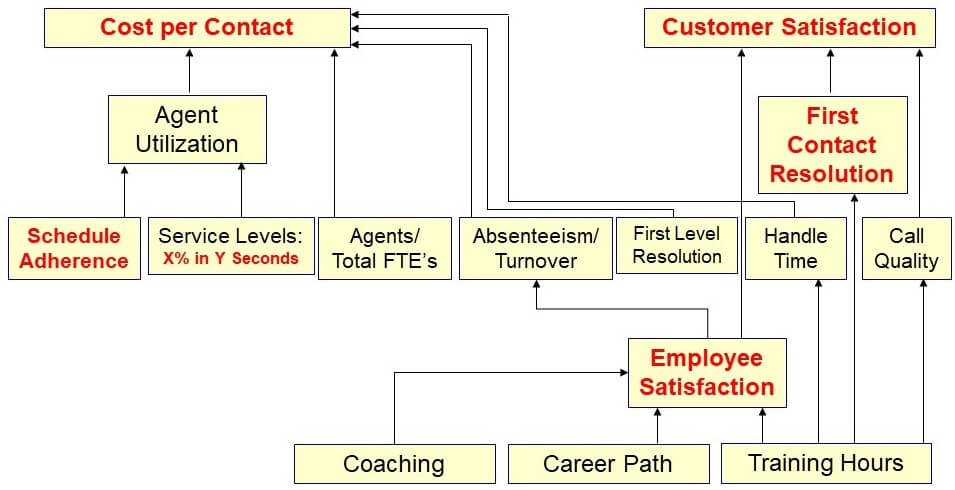
Figure 4: First Contact Resolution vs. Customer Satisfaction
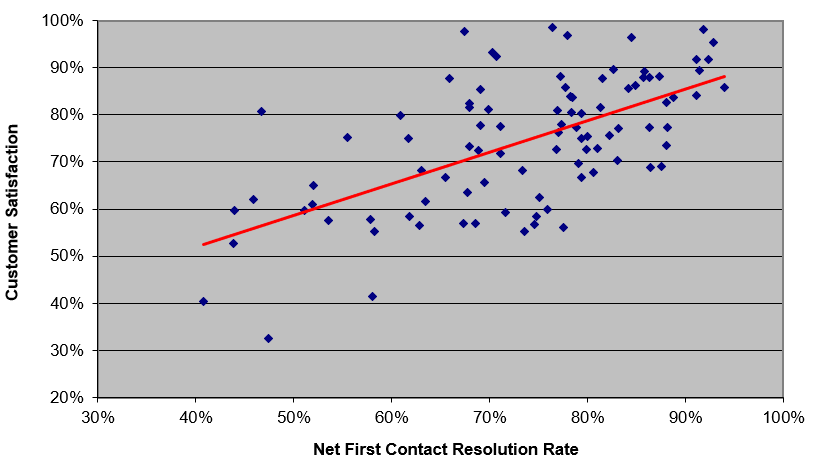
Figure 5: Agent Job Satisfaction vs. Customer Satisfaction
Please join us for next month’s Metric of the Month: Agent Utilization, a contact center productivity metric that impacts cost per contact and many other KPIs.