External Vendor Data Reporting Process
- Data is updated by interval for all External Vendor recipients from the applicable LOBs
- We increase our monitoring for Call Volume anomalies to escalate to Technical Support
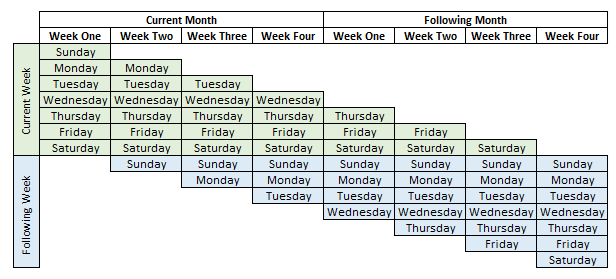
- Each additional External Vendor update by interval is placed in correspondence to the prior data and retroactive volume adjustments are identified on the EVT [External Vendor Tool]; graph provided below
- These adjustments are then applied to the Temp FC Adjustment Tool to determine what intervals have ‘complete’ data [identified in red in the ‘By Interval’ graph] and which intervals contain ‘incomplete’ data [identified in green in the ‘By Interval’ graph]
- External Vendor data can adjust continuously for a single interval and as retroactively as 3-4 hours
- It is imperative to have an explicit awareness of what intervals are ‘complete’ in order to maintain this process accurately and not require additional and unnecessary adjustments to LOB FCs several hours after the fact.
- All External Vendor data intervals are then applied to the 7 Day Delivery Pattern [Simple Moving Average) for primary LOBs (those receiving the lion’s share of volume) to determine a current Trend Analysis in comparison to the 7 Day Average
- Internal volume is also monitored continuously for smaller LOBs including Transfer Lines
- FC Notifications with this Call Volume Pattern are distributed
- As needed, FC and AHT revisions are applied and noted
- After each FC Notification distribution, the process detailed above begins again
- I’m tired just reading through all those steps
A Rolling Forecast ‘Ripple Effect’
By Interval

By Day
Recommendation for a Highly Variable Environment
For a highly variable call center environment, where call volumes are subject to frequent fluctuations due to various factors such as seasonality, marketing campaigns, product launches, or unforeseen events (e.g., system outages or natural disasters), a rolling forecast is undeniably the applicable method.
Why?
- Adaptability: Rolling forecasts allow the call center to quickly respond to unexpected increases or decreases in call volume. This ensures that staffing levels are adjusted proactively, reducing the risk of either overstaffing (leading to higher costs) or understaffing (resulting in poor service levels and longer wait times).
- Real-time Adjustments: In a volatile and unpredictable environment, until Quantitative analysis determines recurring trend patterns, call volume patterns can change dramatically from interval to interval, day to day, or week to week. A rolling forecast enables the call center to integrate new data continuously, such as call trends or changing customer behavior, to refine predictions and ensure accuracy.
- Long-term Planning with Flexibility: While a static forecast is rigid, a rolling forecast provides the best of both worlds by maintaining a long-term perspective (e.g., if needed, forecasting for the next months) while allowing adjustments as each month progresses. This provides stability but also recognizes, responds, and accommodates changes.
- Improved Accuracy: In a fast-paced environment like FEMA, accuracy in forecasting directly impacts survivor satisfaction and cost efficiency. Rolling forecasts improve accuracy by incorporating the most recent information, making predictions more reliable and relevant for scheduling and resource allocation.
Full Contact Comparison
While both Static and Rolling Forecasting involve call volume, trend analysis, forecast projections, and staffing requirements, they couldn’t be more polar in their appropriate settings for each.
A Static Forecasting environment is most often serene, still, few to no call spikes, all volume is explainable and anticipated, and with little to no external interference; we can view this posture as Figure skating.
By contrast, a Rolling Forecast environment is repeatedly blindsided by unexplainable volume, demanding revisions for a trend analysis to point us toward the light at the end of the tunnel, call spike after call spike after call spike, and revising staffing frequently for adequate coverage against the avalanche of volume threatening to break the previous ‘Calls in Queue’ Record; we can view this posture as Ice Hockey.
Admittedly, there are numerous similarities.
Both sports are played on ice rinks, requiring players and skaters to navigate a smooth, frozen surface.
Participants in both sports need strong skating abilities, including balance, speed, and agility. Both use ice skates, though the design differs significantly.
The Differences?
Let’s just say, if you send a Figure Skater to engage an ‘Ice Hockey’ call volume environment, when requesting a Forecast to Actuals Accuracy Update, you might instead find an associate suffering from a concussion, trying to focus and count the number of teeth they are holding in their hand, and asking about the company’s Dental Coverage with a renewed sense of urgency.
Knowing your call volume environment in Forecasting is the equivalent of fully understanding the appropriate genre in literary critique; the reality you are engaging to interpret matters and impacts all outcomes of analysis.
Know your environment.
Forecast appropriately.
Sending Figure Skaters to play Ice Hockey, while humorous, isn’t helpful.
Disclaimer: Sharing information on ICMI’s website is not intended to be an endorsement of ICMI. The views expressed in the article do not necessarily represent the views of the Department of Homeland Security or the United States Government.