Best of ICMI in 2021 - #1
Each month, MetricNet highlights one Key Performance Indicator (KPI). We define the KPI, provide recent benchmarking data for the metric, and discuss key correlations and cause-and-effect relationships for the metric. The purpose of the column is to familiarize you with the Key Performance Indicators that really matter to your organization, and to provide you with actionable insight on how to leverage these KPIs to improve your performance!
This Month’s Metric: Cost per Contact
Cost per unit is a common metric throughout our economy. Many of you know the cost of a gallon of gas, or the cost for a cup of coffee, or the cost of a movie ticket. Yet surprisingly, many contact center managers do not know their own Cost per Contact.
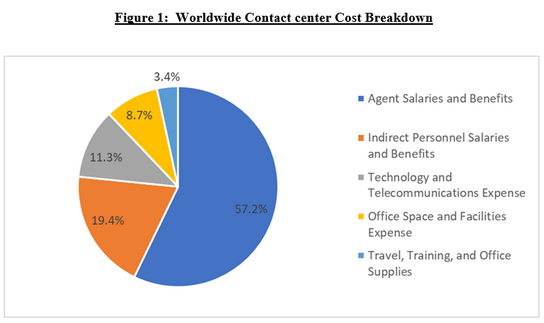
Cost per Contact is the total monthly operating expense of a contact center divided by the monthly inbound contact volume. Operating expense includes the following components:
- Salaries and Benefits for contact center agents
- Salaries and Benefits for Indirect Personnel (Team Leads, Supervisors, Workforce Schedulers, QA/QC Personnel, Trainers, and Managers)
- Technology and Telecom Expenses (computers, software licensing fees, ACD and VRU costs, telecom headsets and handsets, etc.)
- Facilities Expenses (office space, utilities, insurance, etc.)
- Travel, Training, and Office Supplies
Contact centers are labor-intensive. So, as you might expect, the vast majority of costs for a contact center are personnel-related. Figure 1 below shows the average cost breakdown for contact centers worldwide. This cost breakdown remains relatively constant from country to country, and from region to region.
Why It’s Important
Cost per Contact, along with Customer Satisfaction, are often referred to as the foundation metrics for the contact center. They are the two most important metrics because ultimately everything boils down to cost containment (as measured by Cost per Contact), and quality of service (as measured by Customer Satisfaction).
In any customer service organization, cost, or more accurately unit cost, is critically important. Cost per Contact is a measure of how efficiently a contact center conducts its business. A higher-than-average Cost per Contact is not necessarily a bad thing, particularly if accompanied by better than average customer satisfaction and service levels. Conversely, a low Cost per Contact is not necessarily good, particularly if the low cost is achieved by sacrificing service levels or customer satisfaction. Every contact center should track and trend Cost per Contact on a monthly basis.
Key Drivers of Contact center Cost per Contact
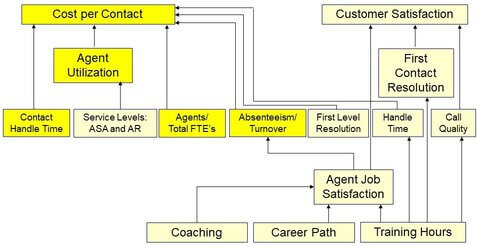
The cause-and-effect diagram below shows how some of the most important metrics in the contact center are interconnected and interrelated. We can see that Cost per Contact has a number of key drivers. The most important of these drivers are Agent Utilization and Contact Handle Time. Secondary drivers include Absenteeism, Turnover, and the Ratio of Agents to Total Contact center
Headcount. These KPIs have been highlighted in the diagram below.
Figure 2: Contact center Cause-and-Effect Diagram
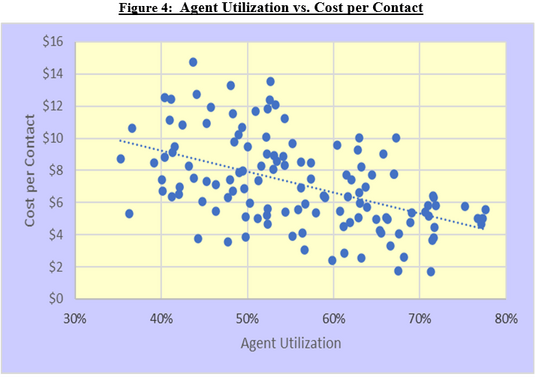
The correlation between Contact Handle Time and Cost per Contact, and between Agent Utilization and Cost per Contact is illustrated in the two charts below, each containing 125 data points.
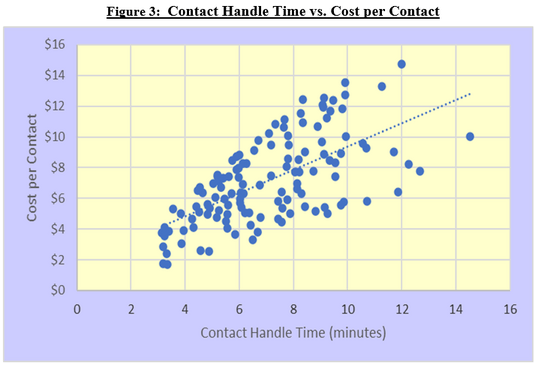
The relationship between handle time and Cost per Contact is fairly intuitive. Increasing handle times mean increasing work per contact. For a labor-intensive function, that means costs will increase correspondingly. But what accounts for the wide variation around the mean? Why is the cost for a six-minute contact $4 for one contact center and $9 for another contact center? The answer is wage rates. Specifically, the wide variation in wage rates within a country. As wage rates vary, so too will Cost per Contact. Operating a contact center in a geographic location with lower average wage rates will result in a lower average Cost per Contact. Conversely, operating a contact center in a major metropolitan area where wages tend to be much higher will produce a much higher Cost per Contact.
The relationship between Agent Utilization and Cost per Contact is also intuitive. Higher utilization means greater productivity and lower costs. The variance around the mean for this chart is even greater than for Cost vs. Handle Time. The reason is that in the utilization chart we have not normalized for handle time. So, it’s possible to have a $4 contact at 50% utilization as well as a $14 contact at 50% utilization if the handle time for the $14 contact is much longer.
What about the secondary drivers of cost – absenteeism, turnover, and the ratio of Agents to Total Headcount? Absenteeism increases costs because a contact center will need to offer overtime hours or retain additional staff in an amount equal to the absentee rate. Let’s say, for example, that a contact center has an average absentee rate of 5%. That means they will be operating at 95% capacity and will need to add additional headcount or offer overtime hours to make up for the 5% capacity shortfall.
Turnover is costly because, on average, it costs about $10,000 to replace a single contact center FTE in North America. This includes the cost of finding a suitable candidate, background checking them, training them, and the learning curve costs once the agent starts working in the contact center.
Finally, the Ratio of Agents to Total Contact center Headcount is a measure of managerial efficiency. The average for this metric worldwide is about 85%. What this means is that 85% of contact center personnel are in direct, customer facing service roles. The remaining 15% are supervisors, team leads, trainers, schedulers, QA/QC personnel, etc. If this number is much lower than 85%, it means that the contact center is top heavy; it has too many indirect personnel. If the number is too high, it means that the managerial span of control is not tight enough, and there may be a lack of supervision.
Cost per Contact by Channel
Channel mix is rapidly evolving and is considered one of the industry’s megatrends. In 2007, voice contacts represented almost 80% of all contact volume. Today, voice accounts for less than 50% of incoming contact volume. Virtually every contact center is now multi-channel or omnichannel. The most common channels include voice, chat, email, web-submit, walk-up, self-help, and SMS.
There are two key drivers behind this trend. One is economic, and the second is demographic. The key economic driver is that voice, which has dominated the industry for decades, is one of the most expensive channels, while chat, email, web, and self-help are all lower cost than voice.
Self-help contacts are lower cost than voice for obvious reasons, but it’s not so obvious why chat, email, and web-submitted contacts are lower cost than voice. Since voice is a real-time channel, the Erlang distribution of incoming calls tends to be very spiky. This, in turn, makes it challenging to staff the voice channel efficiently. The voice channel is perpetually either understaffed or overstaffed. Chat is also a real-time channel, but an effective chat agent can often handle two or more concurrent sessions, thereby making chat more efficient than voice. In fact, MetricNet’s benchmarking data shows that the average contact resolved in chat costs just 76% as much as a contact resolved in the voice channel.
Email and web-submitted contacts tend to be lower cost than voice because these channels do not have quite the same real-time urgency as voice, and they are therefore less spiky than voice and chat. This makes it easier to staff the email and web channels, which leads to better agent utilization and lower costs. On average, the cost of an email or web-submitted contact is about 81% of the cost of a voice-resolved contact.
What about the demographic drivers behind channel mix? If you look at a spectrum of consumers, from younger to older, younger consumers tend to prefer self-help or the indirect channels of chat and email, while those who are in older demographics lean much more heavily on live voice as their go-to channel for service.
Ideally a contact center should know its Cost per Contact by channel. Many contact centers engage in active efforts to deflect contacts into lower cost channels. This has the effect of driving down the average Cost per Contact, thereby making the contact center more efficient.
Benchmarking Ranges for Cost per Contact
The North American averages and ranges for Cost per Contact, and Cost per Minute of Handle Time are shown below, in Figure 5. These statistics include all inbound channels.
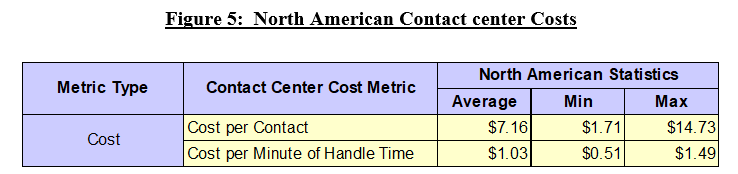
The ranges for Cost per Contact (min to max) are enormous, varying by almost an order of magnitude (10X) from min to max. The reasons for this have been explained above, and include variations in average handle time, wage rates, utilization, absenteeism, turnover, and the Ratio of Agents to Total Contact Center Headcount.